One and a half times the budget price of the Market Pass, i.е. 388 million euros, consumers paid extra for food and everyday items in the first half of this year, without even allowing themselves “anything extra”, compared to the corresponding period in 2022.
Six-month total supermarket sales were €4.428 billion, up from €4.040 billion in the same period last year, up 9.6%, according to Circana (formerly IRI). Inflation is entirely responsible for the EUR 388 million increase in sales value, as there was zero growth in sales over the same period, with sales up 0.5% last year compared to 2021.
As a reminder, the financial costs of the Market Pass in 2023 will amount to 251 million euros, and 2.8 million households with 7.5 million members of the social program will be the beneficiaries.
https://www.rua.gr/news/bissecon/57387-market-pass-2-novyj-vitok-programmy-s-15-sentyabrya.html
However, it should be noted that, according to experts, in the first two weeks of July, thanks to tourism, an increase in sales was recordedsince it was during this period that the indicator “jumped” by 3.1%.
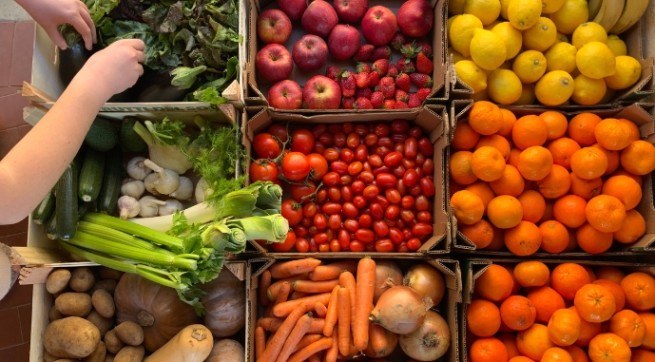
In the first half of the year, categories such as food, household and personal care products in supermarkets recorded higher “inflationary income”: Food accounts for the lion’s share at €3.379 billion, up from €3.094 billion in the first half of 2022.
Due to the beginning of tourist flows The largest increase in sales was recorded in the region of Crete with 17.5%, followed by Northern Greece with 11.8%, in third place is the Peloponnese with 11.1%. Central Greece and Attica are next with 8.8% each, while Thessaloniki is in last place with 8.7%.
https://rua.gr/news/bissecon/statistika/55831-vzryvnoj-rost-tsen-produkty-pitaniya-lekarstva-odezhda-itd.html
The largest price increase in six months was recorded in the “snacks”/snacks (chips, etc.) categories with 14.9%, followed by personal care products with 13.1%, dairy products in third place with 12.7%, followed by followed by household chemicals with 11.3% and household items with 10%.
By sales volume largest decline recorded cereals (4.2%) and frozen foods (4.1%), followed by household chemicals (2.3%), packaged foods (1.8%), personal care and beauty products (0.8% ), dairy products (0.6%) and other household items (0.5%).
On the contrary, in four categories there is sales growth (snacks/snacks 4.9%, soft drinks 1.9%, alcoholic beverages 0.2% and personal care products 2.2%).
To fend off the relentless onslaught of inflation, consumers continued to buy more private label products, which now account for 26.3% between January and June 2023, now including Lidl.
It is impressive that the growth rate of “anonymous” products is almost twice as high as that of branded ones. Specifically, private label products grew by 13.4% and branded products by 8.3%, falling to 73.7% of the total when their share rose to 76.4% in 2021.
At the supply level, suppliers increased shares in the food category to 25.3% and household goods to 24.9%, while in personal care and beauty goods they decreased them to 28.2%, while in the corresponding period last year it was 29.1%.
The highest rate of price growth in various types of stores was recorded mainly in mini-markets and retail outlets up to 400 sq.m (up to 15.8%). In second place are large areas, over 2500 sq.m, with an indicator of 13.9%. The third and fourth places are occupied by shops (supermarkets) with retail space from 400 sq. m to 1000 sq. m and from 1000 sq. m up to 2500 sq. m with indicators of 10.1% and 6.6% respectively.


More Stories
Where will Greeks go for Easter: the best domestic and foreign destinations
Fine 1200 euros for the bad habit of Greeks at Easter, who is at risk
UK: human trial of melanoma vaccine started