


Greece’s seasonally adjusted unemployment rate decreased to 10.8% in January 2023 from 13.7% in January 2022 and an upwardly revised 12.4% in December 2022.
On an annualized basis, the unemployment rate fell by 2.9 percentage points, continuing its downward trend, as evidenced by the data ELSTAT.
ANDWORK FORCE STUDY: January 2023
Hellenic Statistical Office (ELSTAT) announces seasonally adjusted employment and unemployment estimates for January 2023:
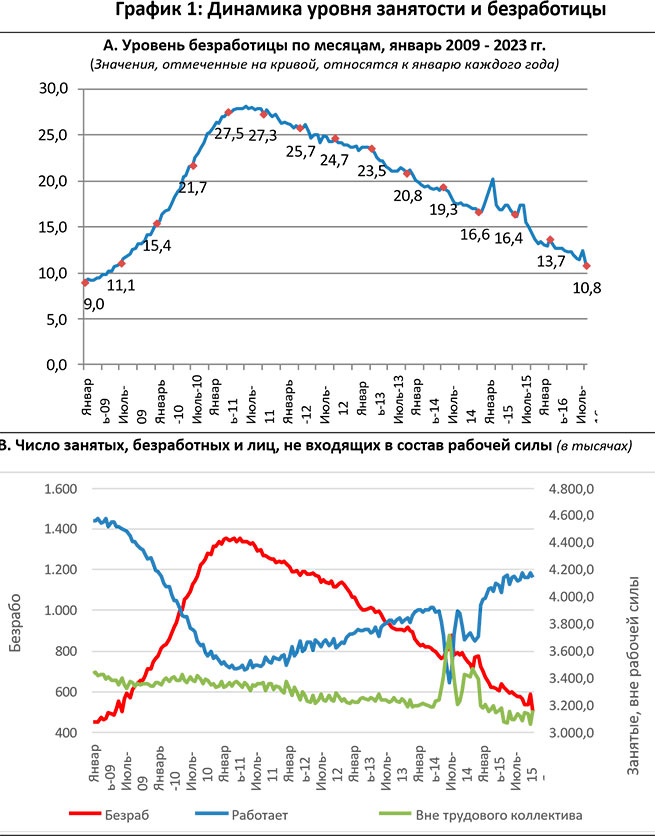
- Seasonally Adjusted Unemployment Rate made up 10,8% compared to 13.7% in January 2022 and an upwardly revised 12.4% in December 2022.
- The number of employees was 4,145,529 people, an increase of 118,588 people compared to January 2022 (+2.9%) and a decrease of 26,314 people compared to December 2022 (-0.6%).
- Number unemployed amounted to 501,948 people, which is 134,764 people less than in January 2022 (-21.2%) and 87,686 people less than in December 2022 (-14.9%).
- Persons under the age of 75 who are not in the labor force, or “persons outside the labor force”, i.e. not working and not looking for work amounted to 3,165,855 people, which is 16,493 people less than in January 2022 (-0.5%), and 110,145 people more than in December 2022 (+3.6 %).
Graph 1 shows the dynamics of the above indicators since January 2009.
And
Monthly estimates are subject to revision due to updating the seasonally adjusted time series each time new monthly data is added, and due to updating the seasonality model with full annual data. Users should also be aware that the initial unemployment estimates for the last month may be subject to revision as they are based on data collected and processed at the time of publication of the news release, which do not match the final. For this reason, monthly estimates are revised when final quarterly estimates become available.
The sizes and changes in estimates of the number of employed, unemployed, persons outside the labor force and the unemployment rate in January for 2018-2023 are presented in Table 1. The full time series is published on the ELSTAT website. Chart 2 shows the percentage change compared to the corresponding month of the previous year.
Table 1: Employed, unemployed, persons outside the labor force and unemployment rate (%) January 2018-2023
|
January |
||||||
|
2018 |
2019 |
2020 |
2021 |
2022 |
2023 |
|
|
busy |
3.771.358 |
3.844.953 |
3.893.859 |
3.736.636 |
4.026.941 |
4.145.529 |
|
Unemployed |
991.121 |
916.935 |
777.677 |
735.138 |
636.712 |
501.948 |
|
Persons outside the labor force |
3.231.241 |
3.191.147 |
3.235.589 |
3.404.967 |
3.182.348 |
3.165.855 |
|
Unemployment rate |
20.8 |
19.3 |
16.6 |
16.4 |
13.7 |
10.8 |
Graph 2: Annual changes in the number of employed, unemployed and inactive persons
(percentage change from the same month of the previous year)

Tables 2 and 3 below present the unemployment rate by sex and main age groups for January for the period 2017-2022.
Table 2: Unemployment rate (%) by sex, January 2018-2023
|
Floor |
January |
|||||
|
2018 |
2019 |
2020 |
2021 |
2022 |
2023 |
|
|
Men |
17.1 |
15.4 |
13.5 |
13.6 |
10.0 |
8.3 |
|
Women |
25.5 |
24.1 |
20.7 |
20.0 |
18.3 |
13.9 |
|
Total |
20.8 |
19.3 |
16.6 |
16.4 |
13.7 |
10.8 |
|
Table 3: Unemployment rate (%) on the maingrown-up gruppam, JanApr 2018-2023 years |
||||||
|
Age groups |
January |
|||||
|
2018 |
2019 |
2020 |
2021 |
2022 |
2023 |
|
|
15-24 |
43.7 |
42.7 |
32.2 |
44.6 |
37.0 |
28.1 |
|
25-74 |
19.5 |
18.0 |
15.8 |
14.9 |
12.5 |
9.8 |
|
Total |
20.8 |
19.3 |
16.6 |
16.4 |
13.7 |
10.8 |
Effects of Seasonal Adjustment on Labor Force Survey Estimates
The characteristics studied in the framework of the labor force survey (the number of employed, unemployed, etc.) show strong seasonal fluctuations. For example, in Greece during the summer months (in the absence of compensatory factors), employment increases due to tourism.
Seasonal adjustment is a statistical technique for removing the effect of seasonality from a time series, thereby making the underlying trend in quantity more visible. When new monthly data are added, the monthly estimates are revised to reflect the updating of the seasonally adjusted time series.
Charts 3, 4, and 5 show seasonally and non-seasonally adjusted time series of employed, unemployed, and unemployment rates since 2017.

Chart 3: Employment – seasonally and non-seasonally adjusted estimates

Graph 4: Number of unemployed – seasonally and non-seasonally adjusted estimates

Chart 5: Unemployment rate (%) – seasonally and non-seasonally adjusted estimates
Revision of Seasonally Adjusted Monthly Labor Force Survey Estimates
Monthly estimates of employed, unemployed and unemployment rates may be revised in the coming months due to the inclusion of new data in the seasonally adjusted time series calculation, the inclusion of the latest quarterly results of the labor force survey in the time series calculation, and the revision of the seasonal adjustment model using full annual data examinations. In this press release, the unemployment rate estimates for the period November 2021 to December 2022 are revised (compared to the corresponding estimates in the previous press release) as follows:
Table 4: Comparison of seasonally adjusted estimates
|
Report published |
Current ratings |
|
|
November 2021 |
13.1 |
13.0 |
|
December 2021 |
12.9 |
12.9 |
|
January 2022 |
13.7 |
13.7 |
|
February 2022 |
13.0 |
13.0 |
|
March 2022 |
12.7 |
12.7 |
|
April 2022 |
12.7 |
12.7 |
|
May 2022 |
12.7 |
12.6 |
|
June 2022 |
12.4 |
12.4 |
|
July 2022 |
12.3 |
12.3 |
|
August 2022 |
12.4 |
12.3 |
|
September 2022 |
11.9 |
11.9 |
|
October 2022 |
11.6 |
11.5 |
|
November 2022 |
11.6 |
11.4 |
|
December 2022 |
11.6 |
12.4 |
|
January 2023 |
– |
10.8 |
More information on the monthly labor force survey can be found on the ELSTAT website at the following link: http://www.statistics.gr/el/statistics/-/publication/SJO02/
More Stories
Greece is at the bottom of the EU in information and communication technologies
Real wages in Greece fell by 30%
ELSTAT: inflation increased by another 3.2% in March