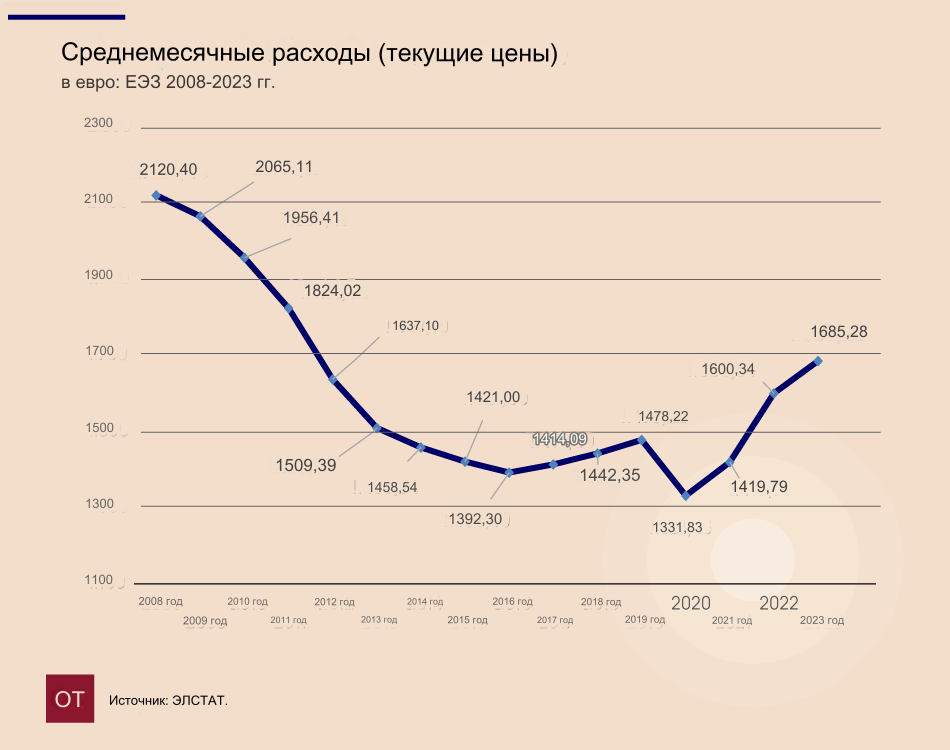
According to ELSTATin 2023, average household spending increased significantly. In particular, the average annual spending on purchases amounted to 20,223.36 euros (1,685.28 per month), which is 5.3% more than in 2022.
50% of households spend more than 1315 euros per month. Renting households spend an average of 16.8% of their budget on rent. At the same time, the share of average expenditure on food, non-alcoholic drinks and housing for the poorest 20% of the population is 55.8% of total household expenditure, while for the richest 20% it is 24.8%.
The highest average annual consumption was recorded in the Attica region – 23,325.96 euros, and the lowest in Central Greece – 14,052.24 euros.
Average annual household expenses in 2023 decreased by 20.5% compared to 2008. Average annual household spending on purchases amounted to 20,223.36 euros (1,685.28 per month), showing an annual increase of 5.3% (1,600.34 euros) compared to 2022. In constant prices, average annual household expenditure increased by 1.7% or €347.16 due to the impact of inflation, according to the 2023 Consumer Price Index, which was 3.5%.
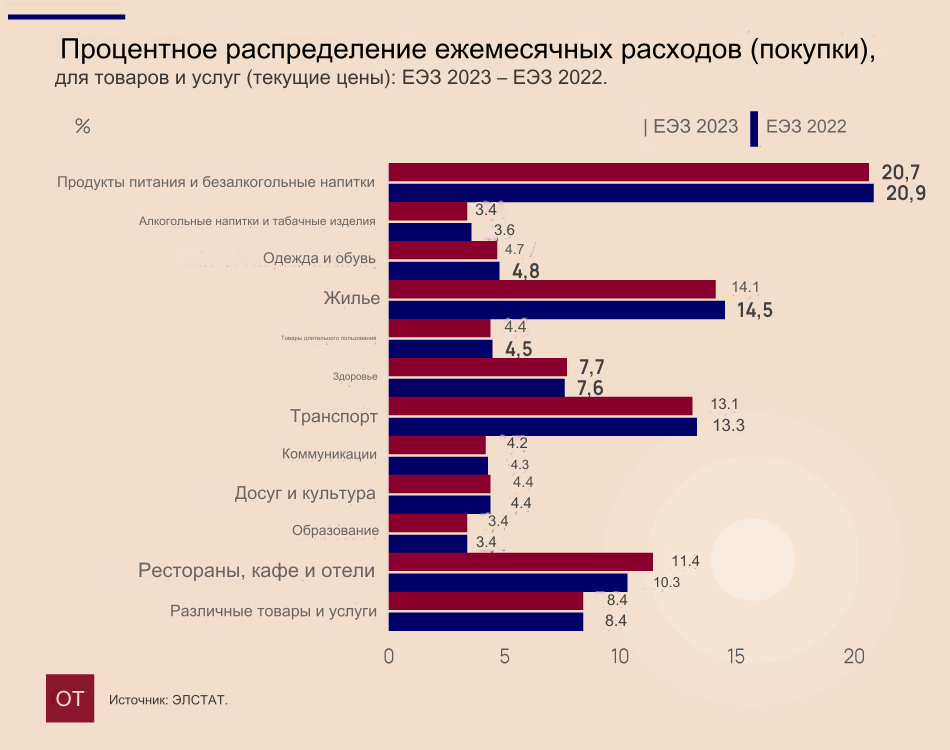
The average annual expenditure per person in 2023 was €8,358.24, an increase of 11.2% (€841.92 per year) compared to 2022 (€7,516.32). The largest share of expenses of the average family budget at current prices falls on:
- food and non-alcoholic drinks (20.7%)
- housing (14.1%)
- transport (13.1%).
At the same time, the smallest share of expenses (3.4%) falls on education, as well as on alcoholic beverages and tobacco products.

According to the table, the largest percentage increase in household expenditures compared to the previous survey (2022) is presented, according to ELSTAT, in the groups:
- restaurants, cafes and hotels (15.9%)
- recreation and culture (7.0%)
- health (6.3%).
The smallest percentage increase was recorded in alcoholic beverages and tobacco products (0.9%).

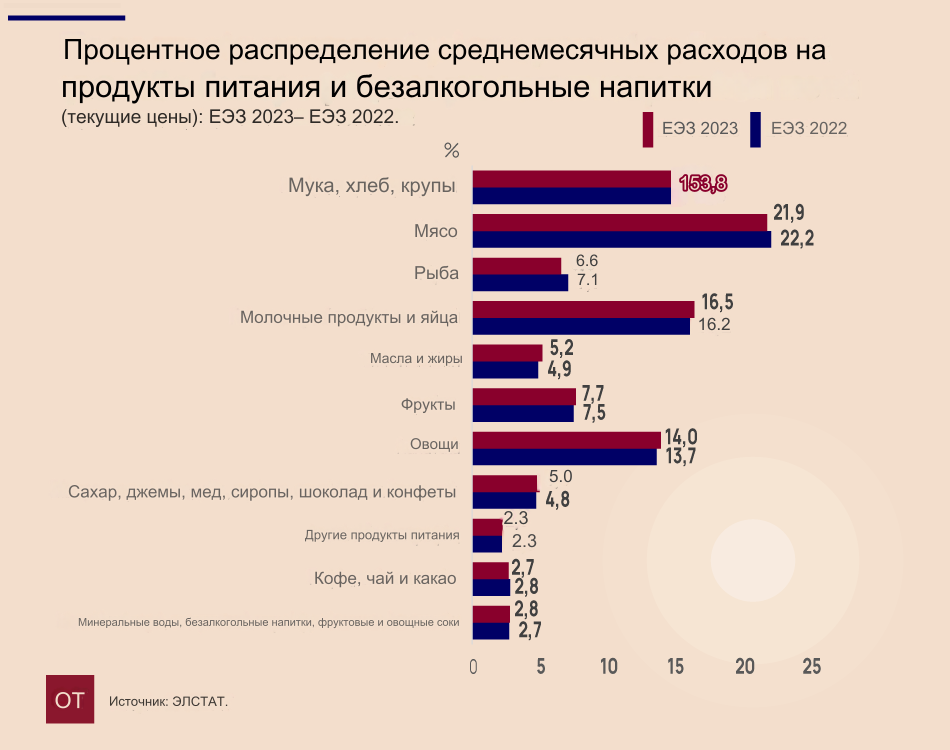
By expenditure on food and non-alcoholic drinks (relative to previous survey in 2022) there is an increase in average monthly expenses (at current prices) for the following categories:
- oils and fats (11.9%)
- sugar, jams, honey, syrups, chocolate (9.8%)
- fruits (7.2%)
- vegetables (6.6%)
- dairy products and eggs (6.6%)
- mineral waters, soft drinks, fruit and vegetable juices (6.1%)
- other food products (6.0%)
- meat (3.3%)
- flour, bread, cereals (1.2%).
At the same time reduction in average monthly expenses (at current prices) is observed for the following product groups:
- fish (3.9%)
- coffee, tea, cocoa (1.2%)
The graph below provides a comparative illustration of the results of the 2023 EOP with data from previous studies for the period 2008-2022. According to the results of the 2023 survey, there is a decrease in average monthly household expenses by 13.9% compared to 2010, while the corresponding decrease compared to 2008 is about 20.5%.


More Stories
Economic tailspin: US and Europe on the brink of collapse
Greek high school students create a self-driving car
Survey: Those returning to Greece face worse working conditions